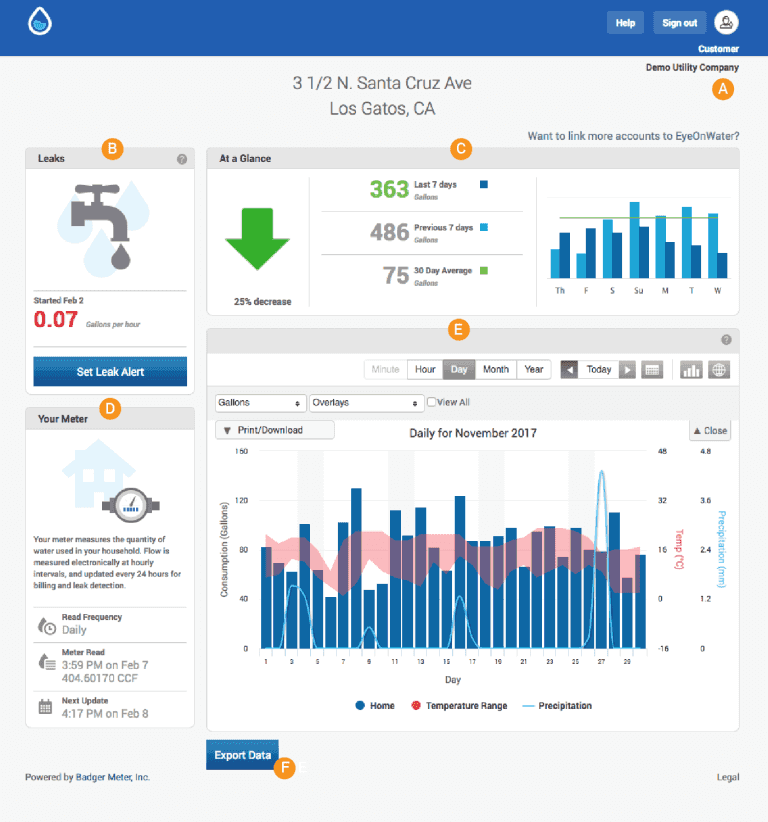
At a Glance

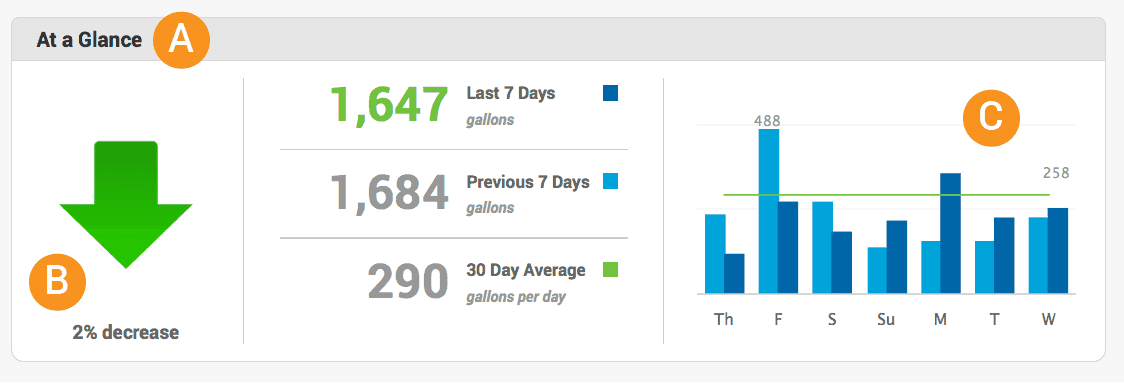
From this section of your EyeOnWater dashboard, you can quickly see whether you are using more or less water than you used in the previous seven days.
The left-most (B) portion of the At a Glance section shows you the percentage increase or decrease of usage over the prior week. The middle portion shows you exactly how much water you consumed during the last seven days compared to what you used during the seven days before that. Your average daily use is also shown.
The bar graph on the right (C) shows even more detail. Hover your cursor over the bars to see how much water you used on a given day and compare it to the same day of the previous week. The horizontal green line shows your 30-day average use.
Your Meter

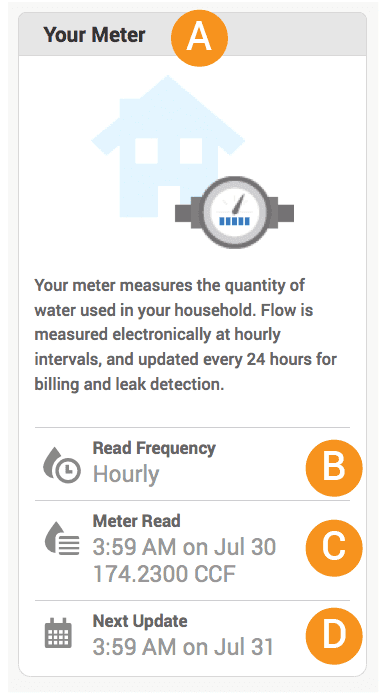
Under Your Meter, see how often your meter is read, the last time it was read, the current reading and when the next reading is scheduled.
CCF stands for Centum (100) Cubic Feet. 1 CCF = 748 gallons. CCF is a standard measure of volume used by some utility companies when billing households for water usage.
Other units of measure commonly used by utilities for billing purposes include 10, 100 and 1000 Gallons (or KGAL).
Consumption Graph

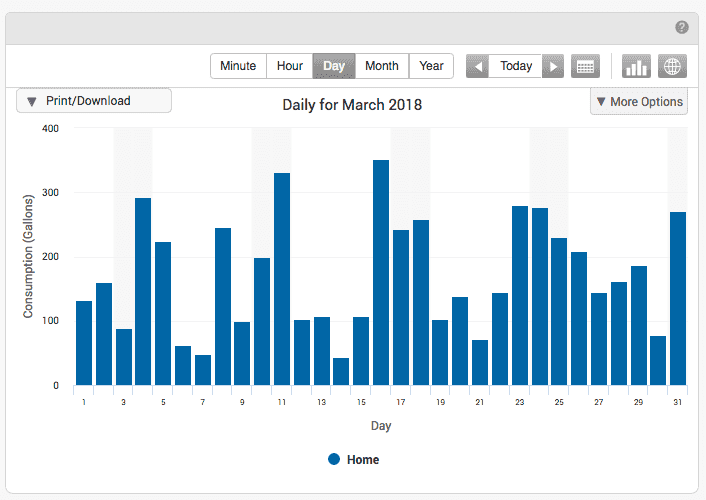
The graph on your EyeOnWater dashboard lets you see your water use for a period of time. Whenever you login to EyeOnWater, the Consumption Graph defaults to displaying your daily water use.
Timeframe
Buttons located along the top of the Consumption Graph let you change the timeframe to minutes, hours, days, weeks and months. Some timeframes require certain metering technology and may not be available. When this occurs, the option will be grayed out.
To change the timeframe of your Consumption Graph, click the Minute, Hour, Day, Week or Month button.
Use the arrows to step back or forward or click Today to jump to the current day.
Click the Calendar icon circled in red and select a month, year and date to jump to a specific day.
Toggle Data Overlays
Click More Options to display a different unit of measure (Gallons, Cubic Feet or CCF) and toggle Temperature Range and Precipitation overlays on and off.
Hover your cursor over any of the overlays to see the value at that point.
At any time, you can click any of the items listed along the bottom of the Consumption Graph to toggle it on and off. In this example, the Temperature Range overlay has been toggled off by clicking the words Temperature Range, which caused them to be grayed out.
Double-click one of the bars to get more detail. For example, start with a monthly view:
Double-click the bar for a month to display daily reads.
Double-click the bar for a day to get hourly reads. Notice the Temperature Range display is flat. That is because temperature is measured daily.
Custom Regions
You can also click and drag to select an area to zoom-in on. In the example below, a blue box shows the area being selected.
On release, the Consumption Graph zooms to display more detail.
To return to the previous view, click Reset Zoom.
Hover your cursor over a bar in the Consumption Graph to see the total amount of flow at that point.
Find Your Meter
In addition to displaying water consumption data, the graph lets you see where your water meter is located.
To view your meter’s location:
Click the Globe button in the upper right corner of the Consumption Graph.
Click the Satellite button to view the location via satellite imagery.
Click the Map button to get a street map view of the location.
Hover the cursor over the Map or Satellite buttons to change the angle of view and toggle street labels on and off.
Use the controls on the left to navigate and zoom in and out.
To return to the Consumption Graph, click the Graph button.
Exporting Data
To export the data used to create your EyeOnWater consumption graph:
- Click the Export Data button
- In the Export Data dialog box, enter a Start Date or use the popup calendar to pick a date
- If desired, select a different Read Interval using the drop-down menu.
- If desired, use the Unit drop-down menu to change the unit of measure.
- When satisfied, click Start Data Export. When the export is complete, download the Results File by clicking the Click to download link.
- View the file using a spreadsheet program such as Microsoft® Excel® or Google Sheets™.
- NOTE: To compare the serial numbers (SN) on your water meter and its endpoint (the device used to send information from your meter to the utility company), the EndpointSN, MeterID and Meter_SN are located in columns C, D and E of the spreadsheet file.
